WTF Heteroscedasticity

TL;DR
- The proportional effect states that the variance of a subset of your data is proportional to the mean grade of that subset (i.e. your variance in high grade zones is not the same as your variance in low grade zones)
- This is mainly an issue when you are estimating with original units (i.e. no gaussian transformation) and will effect your variogram inferences and the prediction of the local kriging variance.
What is the Proportional Effect?
If you want an easier term to say then Heteroscedasticity and don’t want to sound like a douche… then welcome to the proportional effect! All jokes aside… the proportional effect is an aspect of heteroscedasticity and has the benefit of being way easier to say. Simply put, if you are observing the proportional effect the local variance of your dataset will not equal the global variance of your dataset. In fact, variance will be proportional to the local mean, AKA your variance in high-grade zones will not equal your variance in low-grade zones. The proportional effect is the univariate version of heteroscedasticity.
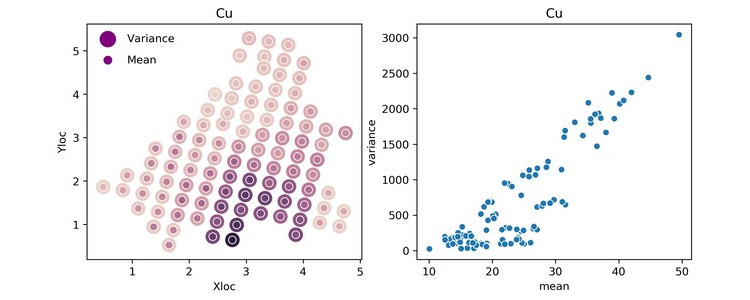
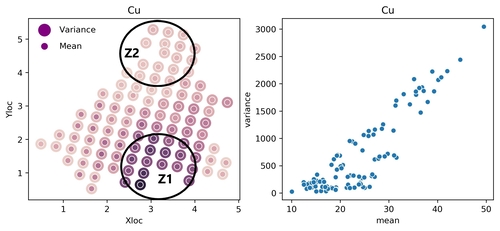
This all means that if the local variance increases when the local mean increases, you know you have a positively skewed dataset and if the local variance decreases when the local mean increases then you have a negatively skewed dataset. Yeah, that’s it in a nutshell. Figure 1 shows the copper grades from the Jura dataset where you can see the proportional effect.

Fig 1: (Left) Plan view showing the Mean and variance based on nearest data (Add color bar) (Right) Variance vs Mean using Moving window statistics
OK cool. Now we know what the proportional effect is telling us about our data. Why should I care? Well, if you have skewed data, that’s obviously something important to note (check!). We probably need to know whether the data is skewed enough for it to affect the scope of our study? You might then ask yourself a few questions:
- Are you planning on modelling in original units?
- Will you need to do volume variance calculations?
- Should I care?
Then you might have an interest in learning more about the proportional effect. Stay tuned for future posts on this topic. Once more post’s go live on this topic you’ll be able to see them here.
Take Away
Know thy data! If your data is skewed, then you will probably have to account for it somehow somewhere in your workflow. Many modelling algorithms assume that you are modelling well behaved data (e.g. there is no proportional effect, or the proportional effect has been removed).
Resources
- Manchuk, J., Leuangthong, O., Deutsch, C.V. (2009) Teacher’s aide: the proportional effect of spatial variables. Mathematical Geology, 41(7): 799-816
- Manchuk, J., Leuangthong, O., & Deutsch, C. V., (2006). A New Look at the Proportional Effect: what is it and how do we model it. Centre for Computational Geostatistics Report 8, 109. University of Alberta, Canada.
- Chiles J.P. and Delfiner P. (1999) Geostatistics Modeling Spatial Uncertainty, John Wiley and Sons, Inc.