Exploring the Nugget Effect!
We’ve all been there, staring at those variogram modelling parameters and wondering, “what the hell do I put here for the nugget?!?” It’s always seemed a bit allusive to me, and sometimes you go to put down a number, then you start worrying, “What will people think about me? Is it too big? Is it too small? Have I drank too much coffee this morning?” Unfortunately, I’m not going to tell you what’s the right nugget constant to use today, that’s a topic for another post and might or might not involve witchcraft and offering sacrifices on the altar of the god(dess) of Chaos. Instead, we are going to first look at what does that little ol’ nugget effect actually do!
TL;DR
The nugget is how we account for short range variability/noise in our data. To do this, it decreases the effect of the structures within a variogram model. A larger ‘nugget’ results in estimated values closer to the mean of the available data. Too large of a modelled nugget effect can decrease the variability of the estimated values creating an overly smooth estimation model. The reverse is also true, too low of a nugget can produce a noisier less continuous estimation.
Recap: Parts of the Variogram Model
This might be old news for some of you, especially if you’ve been reading our previous posts on all things variograms, but let’s quickly recap the parts of the variogram.

For each of the directions that make up a variogram, there are four main features of the variogram. The nugget effect, the sill, the max range for that direction, and the type, or shape, of the variogram, for example, exponential. With increasing distance the variogram model approaches the sill; at the sill it’s saying there is no spatial correlation beyond that distance, and any data points beyond that distance should have little to no effect on the estimated value. The max range is the point where the variogram model reaches the sill, and the model structure, such as the exponential structure, shows how the spatial correlation changes over distance.
What is the Nugget Effect
For those of you out there who are confused about what the nugget effect is, this may be because it has two different definitions: the geological and the geostatistical definition. The geological definition describes very high-grade gold that occurs discreetly from the more disseminated gold mineralization. While the geostatistical definition is what we’re talking about, I’ll define it in more detail here.
The nugget effect is one of the parameters of the variogram model. Yeah, I know that’s a given, but what is this parameter? Well, this parameter is a way for us to account for short scale randomness/noise in our variable(s) of interest. There are many things that can affect the “correct” value for the nugget, from actual short range continuity of the variable, to the volume of sampling, quality of sampling such as the accuracy and precision of the assay values, accuracy and precision of the drill hole survey, and the sample lengths.
As a parameter, the nugget is a constant. So it’s applied equally to all orientations of the variogram model. Now the caveat to this being, it is possible to “hack” the model to create a nugget effect that is in practice different in the different directions by adding an extra structure. This is rarely done though. It’s usually hard enough to have a good warm fuzzy feeling about one nugget, let alone to determine that you actually have an anisotropic nugget that you need to account for. If you can figure that out, you probably should be writing this post instead of me!
If you want to go further down the rabbit hole of what the nugget effect is, I’d suggest checking out this post.
The Nugget and Kriging Weights
Why do we care about the nugget effect? Well cause it’s part of the all important variogram equation that is getting plugged into our kriging engine and therefore, just like every other parameter in that equation, can “dramatically” (theme music in the background) affect the final estimated values. Have you dived down the road of simulation? If so, the nugget effect can play an even more important role, but again another topic another day. (Back to the theme music) let’s dive into an example!
First let’s set up an example dataset. We’ll go ahead and throw together eight samples spaced randomly around our location of interest that would represent some samples found in our “search range.” The figure below shows the location, grade value, and the locations of the eight points we are going to use to estimate our “location of interest,” marked with a question mark.
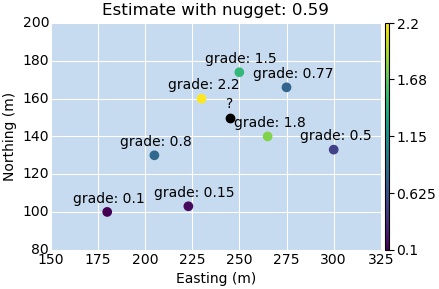
As you can see, we have some low grade samples, predominantly to the southwest, and some high grade samples arranged somewhat close to our estimation location but to the north and east. Further to the east we have some, “I don’t know what’s going on” random samples hanging out there for fun.
Here are some of the quick stats for our sample data
| Data Stats | |
|---|---|
| N samples: | 8 |
| Sample Mean: | 0.978 |
| Sample Variance: | 0.600 |
| Sample Min/Max: | 0.1 to 2.2 |
Now I’ll set up a series of variograms (omni-directional for this example) to show how change in the nugget will change our calculated weights and subsequently the estimated value when using the ordinary kriging (OK) engine. Here’s the variogram’s I’ll use:
| Variogram Parameters | |
|---|---|
| Structure: | Exponential |
| Max Range: | 80 |
| Nugget Effects: | [0.01, 0.05, 0.1, 0.3, 0.59] |
| Sills: | [0.600, 0.600, 0.600, 0.600, 0.600] |
So we have a series of variograms with increasing nugget effects. The sill stays at the sample data variance up until the nugget is larger, then I just set the sill to a slightly higher value. Now lets plot them up! Here I’ll switch from displaying the variogram value to displaying both the calculated weights and the covariance value. The kriging engine converts the variogram to covariance anyway, and the nice thing with looking at the covariance value is, as a generalization, as it approaches zero you know that it’ll affect the estimate value less.
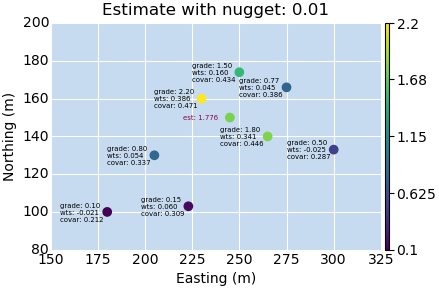


So what do we see? As the nugget increases, the covariance gets closer and closer to zero for all samples within our “search range”. The kriging equation is then solving for the weights based on the covariance value, which shifts all of the weights to an equal value. There are some more caveats here that are important/highly interesting. The results will depend on your kriging engine.
Here the estimate approaches the mean of the sample data within our “search range” because we are using the OK engine. The OK engine re-calculates the local mean when making it’s estimation. If you instead use the Simple Kriging (SK) engine, then our estimation will instead get pushed towards the global mean.
This leads to some interesting observations. A large nugget effect will lead to an estimate that approaches the mean of the data used. This in essence turns the ordinary kriging engine into a N-nearest neighbors engine. What about the opposite? When you use a nugget that is lower than the “correct” value, you will get a less continuous estimation model. So if your model is too smooth, sometimes decreasing the nugget can help.
Summary
So the nugget effect is a way for us to account for short range spatial variability that could be caused by a number of factors. The larger the nugget, the less our spatial model is being allowed to influence our estimation. The extreme is when the nugget effect approaches or surpasses the variance of our data, in this case our estimation is forced to the mean of the available data. A smaller nugget can help with an overly smooth estimation model. The “correct” value might be more up to the Goddess Eris than us.
Teaser
Determining the “correct” nugget effect makes me believe more and more in witchcraft. The “common” approach is to calculate a downhole variogram and use that to estimate our good ol’ nugget. More often than not it’s probably lower than you think, and even this approach doesn’t often leave me with warm fuzzy feelings. Honestly, this does deserve a, potentially, large post all on it’s own, and falls under the “art” part of geostatistics.
-
The banner image was pulled from wikimedia commons and is titled 1850_Woman_and_Men_in_California_Gold_Rush ↩︎