Communicating Accuracy and Precision

TL;DR
In the traditional sense, accuracy and precision measure how close a series of observations is to the true value and how variable those measurements are. However, we can apply the concepts of accuracy and precision to how we communicate our ideas and workflows. We implicitly or explicitly communicate accuracy and precision in our tables, figures, text, and 3D models. Being aware of what level of accuracy and precision that we intrinsically bake into how we communicate our ideas and workflows can help us make sure we get it right.
Introduction
During my master’s thesis defence, I got asked to explain what accuracy and precision are, and how they are different. I messed up the answer; it was sad. I’ve since wrapped my monkey-brain around the two concepts, thankfully. I recently started to think about how we bake in various levels of implied accuracy and precision in how we communicate our work. Our tables, figures, text, and 3D models all intrinsically communicate accuracy and precision.
This post is a bit of a deviation from our usual style of breaking down a topic and laying out the facts and letting you do what you will with it. Instead, this post leans towards an opinion piece hoping that it provides a new twist on how we can extend the “traditional” sense of what accuracy and precision are and offer a new way of thinking about how we communicate.
“Traditional” Definition of Accuracy and Precision
In what I’m calling the “traditional” definition of accuracy and precision, accuracy is the measure of how close the observations are to the true unknown value. In contrast, precision is the measure of the “spread” in a series of observations. We traditionally think about accuracy and precision when we think about data. The interweb is riddled with discussions about accuracy and precision; therefore, I won’t belabour the point here.
QAQC Example
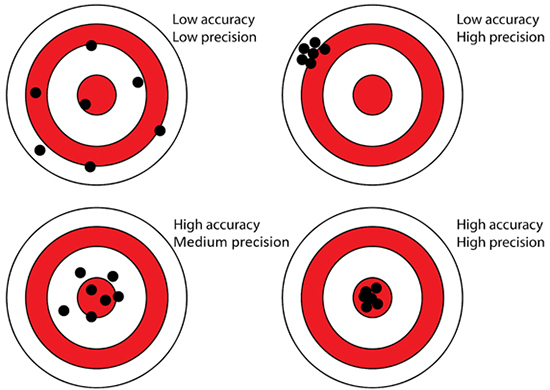
The figure below is a fantastic representation of both accuracy and precision. When looking at this figure, I like to imagine how it applies to the results of a standard reference material used during a QAQC program. The center bullseye represents the standard reference material’s true value, while each “shot” represents the assay of each reference material sample submitted to the lab. In this scenario, each subfigure represents the following:
- Upper Left: assays that are highly variable (low precision) that do not converge on the true value (low accuracy).
- Upper Right: assays that have very low variability (high precision) that do not converge on the true value (low accuracy).
- Lower Left: assays that are moderately variable (medium precision) that converge on the true value (high accuracy).
- Lower Right: assays that have very low variability (high precision) that do converge on the true value (high accuracy).
Calculating Accuracy and Precision in Resource Estimations
In the context of resource estimation, you can quantify the accuracy of simulated or estimated (kriged) models through cross-validation techniques. However, you cannot calculate precision without completing a simulation study, where you calculate many equally probable realizations, making precision the least often demonstrated of the two. Accuracy and precision from these studies can be evaluated by:
- Precision: Calculating the probability that the simulated block values are within some percentage threshold of the mean block value.
- Accuracy: Completing a cross-validation study that evaluates simulated values closeness to the “true” value.
This topic deserves it’s own post and is beyond the scope of this conversation. Oh boy, we are all using this “get out jail free card” a lot, aren’t we!! So many cool things to talk about; how do we even sleep at night!
Accuracy and Precision in How We Communicate
In addition to thinking about accuracy and precision in the traditional sense, I find it interesting to apply the concepts of accuracy and precision to how we communicate our ideas and workflows. Trying to express our work in a highly accurate and precise way can make it very difficult for others to understand our work, specifically when attempting to be highly precise. We can look at many different communication mediums and find various levels of accuracy and precision that are explicitly or implicitly expressed. Within each medium, there are different trade-offs to the level of accuracy and precision expressed. For example, here’s how I think about accuracy and precision in four mediums I’m familiar with.
Peer-Reviewed Studies
In theory, peer-reviewed studies are a very detailed description of someone’s work that can be a challenge to absorb unless you’re an expert in the area of study. Someone with a general interest would find it difficult to absorb all the work’s nuances as the communication style is incredibly detailed involving discipline specific terminology or jargon. Accuracy, in this case, would depend on the reproducibility of the work by others.
Textbooks
Textbooks are a collection of many sources, making them an excellent source for accurate and precise information. However, they take a long time to work through as complicated concepts need to be slowly built up, so the reader has the background knowledge to understand them.
Lazy Modelling Crew Blog
On this blog, we are continually having internal conversations about how we must sacrifice some precision to explain concepts that can be absorbed easily. While we maintain high accuracy, precision is the primary sacrifice here as we must avoid going into exhaustive detail about all the what-ifs, exceptions, and in-depth theory. If we feel additional information is required, we tend to break up concepts into bite-sized pieces. One of our goals is that you won’t need to read the same paragraph 5-times to know what we’re saying. And we totally nail it, 80% of the time, every time. Right!?
Resource Estimation Memos and Chapter 14’s in 43-101
Lastly, we riddle our work as resource modellers with implied accuracy and precision. We communicate the workflow and parameters used during our resource studies in 43-101’s or resource memos with various amounts of accuracy and precision.
The geological and estimation domain models we build have an intrinsic level of accuracy and precision. For example, if you model a feature between data points, say an inflection in the boundary of an estimation domain, you’re communicating an understanding beyond what is illustrated by the data. Us beerlogged geologists struggle with this one, LOL! We love to fit our work to our cartoon visualizations of how a deposit works. But for resource work, where is the line between knowledge-driven and data-driven work?
I don’t mean to suggest that everything we do should be both highly accurate and precise. Instead, we should be conscious of both implied and explicit communication of accuracy and precision. To expand on this, I dig into examples of these that I pulled from public documents in the following section.
Examples of Different Levels of Communicated Accuracy and Precision
I’ve pulled a few examples from 43-101 technical reports that illustrate different communicated accuracy and precision levels. I’m not referencing the technical reports these images are from, I’m not on a witch hunt, and I do not intend to critique individuals' work. And yes, I know, I’m cherry-picking images, but for the sake of this discussion, let’s assume these images are the only information we have.
Be warned; these examples and how I classify the level of accuracy and precision communicated with them are all very interpretive. Some of you may agree with my classification of these examples, while others may disagree, which is fine. We’re all unique in our own way, so you do you, and it’ll all be good.
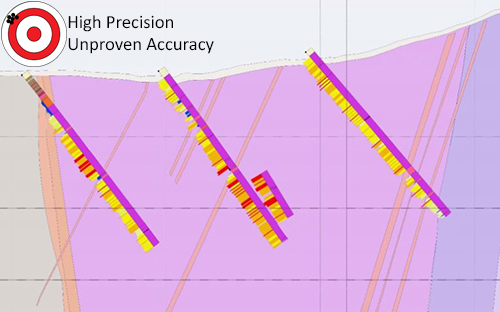
Unproven Accuracy, High Precision
At first glance, you might think the thin planar features dipping to the left in the image below are veins that host some precious metal. However, these are waste dykes, so it’s not super dramatic or critical if done wrong, given the early-stage of this study. The dykes modelled have very exact geometry that extends to surface and depth. In effect, the modeller is communicating a high level of accuracy and precision. Remember, high precision is not dependent on being correct. Accuracy is the correctness measure, which is unproven until new drill holes verify the interpretation.
As these are dykes, this example is not that terrifying. However, this type of modelling, using a single drillhole intercept to constrain thin planar features, is prevalent with early-stage precious metal resources hosted in distinct veins. Now that is scary!
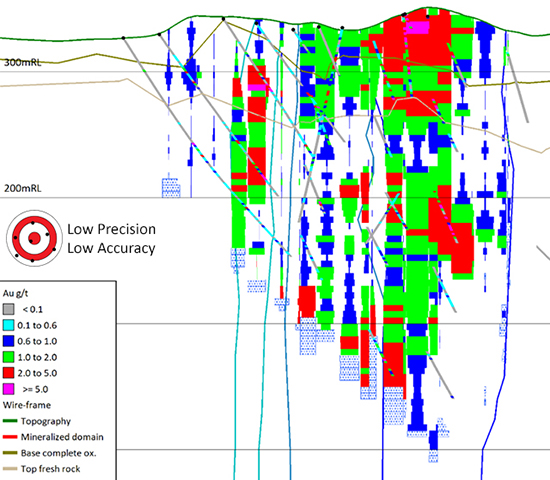
Low Accuracy, Low Precision
I can’t for the life of me understand the figure below. I’ve read the related text within the report, looked at other figures in an attempt to find a pattern, and even stared at it and crossed my eyes, hoping to see the meaning to life. However, the message the author is trying to communicate is not translating. Maybe I’m too simple-minded? All I know is that the vertical box-patterns are not drill holes; those dip to the right in this image (the small black circle is the collar). Are they the block model? What affects the scale of the blocks? Because this figure’s meaning is not apparent, I automatically classify the figure as communicating a low level of accuracy and precision.
Suppose someone explained what is going on in this figure in-person, and it turns out that the figure contains a staggering amount of information that illustrates a very well-validated model. Meaning the model is both accurate and precise. However, my classification of this example would not change. The figure and its supporting text did not do its job.
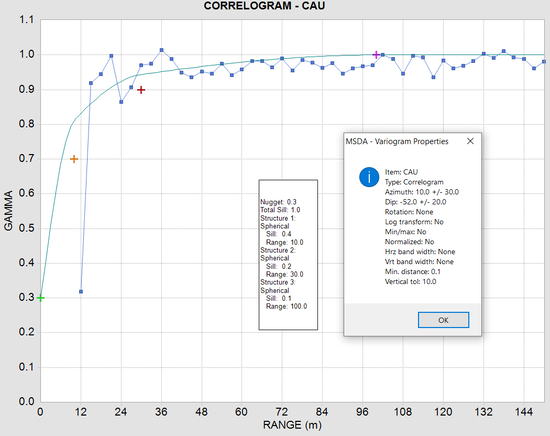
Limited Accuracy and Precision
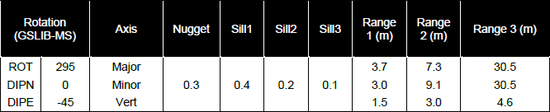
The variogram description in the 43-101 I pulled this example from is minimal. The details included are as follows:
- Two figures illustrate the experimental and modelled variogram for two of three directions (an example is provided below).
- A single table (also provided below).
- A brief sentence that doesn’t directly address variography used to calculate the resource:
“Interpolations have been done based on variography completed where possible.”
The information provided in the table and figure is both accurate and precise, but it is minimal because they only describe one of the 47 estimation domains modelled in this study. Ideally, the reader wouldn’t have to bounce between the table and figure to piece together the model type’s variogram model; the table doesn’t state the type of structures used, the figure does. I have to give this report HUGE props for including the rotation convention used! It is so frustrating trying to reverse engineer what the rotation convention was!
That sentence on the variography study may as well not even exist. Enough said?
For those of you out there wondering why I’m ignoring parameter uncertainty, this is me leaving out a discussion (reducing precision) that involves a more advanced theory that isn’t that well known by those in the resource industry to communicate my ideas a bit easier. 😎
Conclusion
In the end, I will avoid giving you a highly accurate and precise three-step guide to communicating your work. I’m constantly evolving my own opinion of where the balance lies between over-explaining, making sure I’m getting the message across efficiently, and baking just the right amount of accuracy and precision into my 3D models. This line of thinking has helped me recently, and I hope it might also help you when you consider the level of accuracy and precision you communicate.
References
- Deutsch, M. V. (2015). The Angle Specification for GSLIB Software. In J. L. Deutsch (Ed.), Geostatistics Lessons. Retrieved from http://www.geostatisticslessons.com/lessons/anglespecification