WTF is a Variogram??
TL;DR
It’s the representation of the interrelationship of a property between two locations that are separated by some distance and in some direction. We try and understand that interrelationship by calculating an experimental variogram from our data that we then fit a variogram model to. The parameters of the model variogram are then used by some interpolation algorithms to infer spatial correlation for all directions and distances in the domain.
Introduction
The variogram is used in many different types of spatial statistical software packages (e.g., GIS, Mining, or Geophysics), but its meaning and how it’s used can be a bit elusive to figure out. We hope that the “WTF Is a Variogram Series” of posts will help demystify all the things about variograms. We’ll make sure each post in the series is filed under the same category so you can explore them easily. But first things first…WTF is a Variogram 🤔
FYI, this post isn’t meant to be that detailed or consider “what if” cases…but we will dig into specifics in bite-sized pieces. For example, the next post in the series will dig into how an experimental variogram is calculated.
Why It’s Needed
All deposits have some trend or pattern (read: spatial correlation) in all directions. It could be a smooth transition from high to low Fe-Ti-Vi concentrations in a cumulative deposit, sporadic mineralization in a porphyry, or the annoying gold deposit that seems to be all nugget (using the geological not geostatistical meaning of this word here). When you build a block model with estimated metal concentrations, I hope you’d want to understand the metal’s spatial correlation (the observed mineralization trend or pattern), leverage that knowledge, and reproduce it in your block model…RIGHT…RIGHT?! The variogram is one way to define the nature of a metal’s spatial correlation. Lucky for us, Kriging requires a variogram so that this dream can become a reality!
Unfortunately, a lot of practitioners still primarily use interpolation methods that don’t rely on the variogram, such as polygonal estimation and inverse distance (Silva & Boisvert, 2013). The polygonal estimation uses…well… polygons to isolate subsets of data that are “very” similar and assign their average to the volume of rock within each polygon. So no consideration of spatial correlation besides that baked into the way the polygons are constructed. And Inverse Distance Weighting (IDW) assumes the spatial continuity of a metal between two locations is exponential, regardless of direction. Again, no real way to leverage all your knowledge of the spatial correlation.
I’m not getting into Kriging vs. Inverse Distance here that’s for another post. It’ll be a banger! Who’ll be the brave soul to tackle that one?! 🙈 Actually… Ryan does get into it a little on his post here.
Variogram or Semivariogram?
It’s not important, just think of them as the same and try and be consistent with what you call it. It’s important when you’re geeking out over formulas 😑 but I honestly don’t feel like going more into that rabbit hole of semantics soooo I won’t haha…
Modeled Variogram vs. Experimental Variogram
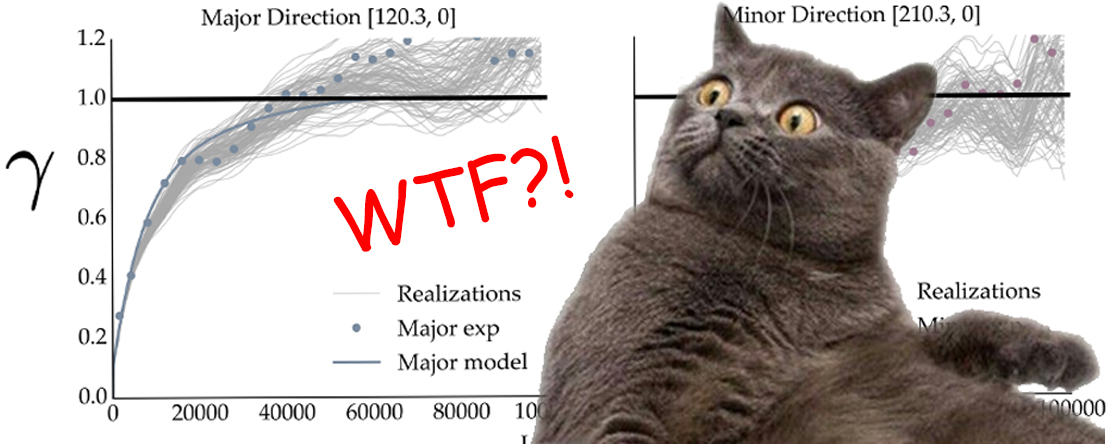
There are two types of variograms: experimental and modelled. The experimental variogram is all the points that you see on a variogram plot. They are calculated along specific directions from the composite assays in your dataset. The modelled variogram is the line on a variogram plot that is fit to the experimental variogram that is defined by a set of parameters (e.g., structure type, ranges, etc.).
How it’s used by Kriging
Long story short, Kriging estimates grade by calculating a linear summation of weighted composites while considering the mean of the data. The variogram is used by Kriging to calculate the weights assigned to your composites.
The not so short version. When Kriging estimates a block, a search ellipsoid is centred on its centroid, enclosing the surrounding composites and flagging them. The distance and direction that separates each of the flagged composites from the block’s centroid are plugged into a variogram equation. The variogram equation is defined by the input variogram parameters you give Kriging. Then with some linear algebra magic, weights are calculated for each composite determining how it contributes to that blocks estimate. So the variogram makes sure that the composites are weighted in a way that considers the spatial correlation observed in your data!
Additional Readings and References
- Silva, D. S. F., & Boisvert, J. B. (2013). Mineral Resource Classification (NI 43 ‐ 101): An Overview and a New Evaluation Technique (Vol. 2013). Edmonton AB. Retrieved from http://www.ccgalberta.com
- Rossi, M. E., & Deutsch, C. V. (2014). Mineral Resource Estimation. Edmonton AB: Springer Netherlands. https://doi.org/10.1007/978-1-4020-5717-5
- Ed Issaks videos on YouTube
- Michael Pyrcz videos on YouTube
- Geostatistics Lessons on Variograms
- The Practical Geostatistics series
- Gringarten, E., & Deutsch, C. V. (2001). Teacher’s Aide Variogram Interpretation and Modeling. Mathematical Geology, 33(4), 507–534. https://doi.org/10.1023/A:1011093014141